
The Well
Ordered Space
July 2026 Performance Audit // order, measured
A single blueprint of the month. Where people found you, what they watched, and where they reached out. Prepared for Errin and Kelly.
Site Overview / GA4
The month at the door
Traffic that arrived at thewellorderedspace.com through July. These are the people who walked in.
Discovery Funnel / Schematic
From visitor to inquiry
The path a person travels from landing on the site to raising a hand. Drag the runner to trace each stage of the system.
The Custom Quote page is your discovery-call page. It runs on a HoneyBook form, and it is now connected as the source of truth for real inquiries. One in five visitors goes there to look, and of everyone who arrives on the site, roughly 1 in 12 ends up reaching out. That is a healthy shape to build on.
Posting Cadence / Goal Tracker
Momentum, honestly measured
The sweet spot is 14 to 21 posts a month per platform. Here is where July landed, and it is good ground to grow from.
@thewellorderedspace
About two thirds of the way to the target, and the pace is steady. A couple more posts a week lands you right in the zone.
The Well Ordered Space
Almost at the doorstep of the sweet spot. One more post a week and Facebook is fully in range.
Top Content / By Views
What people watched
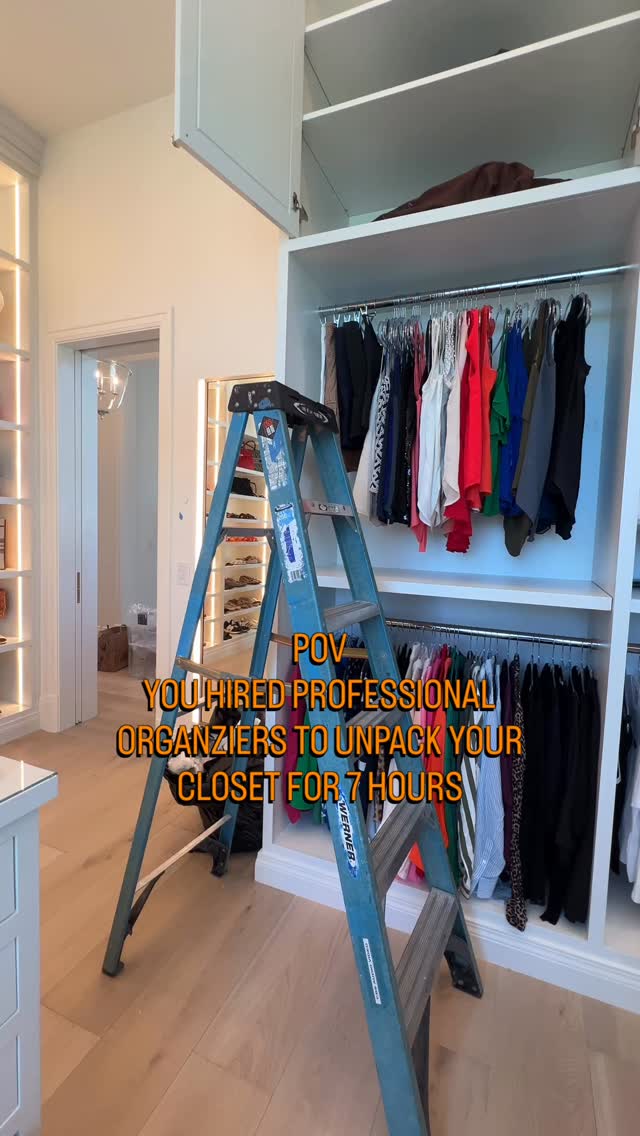
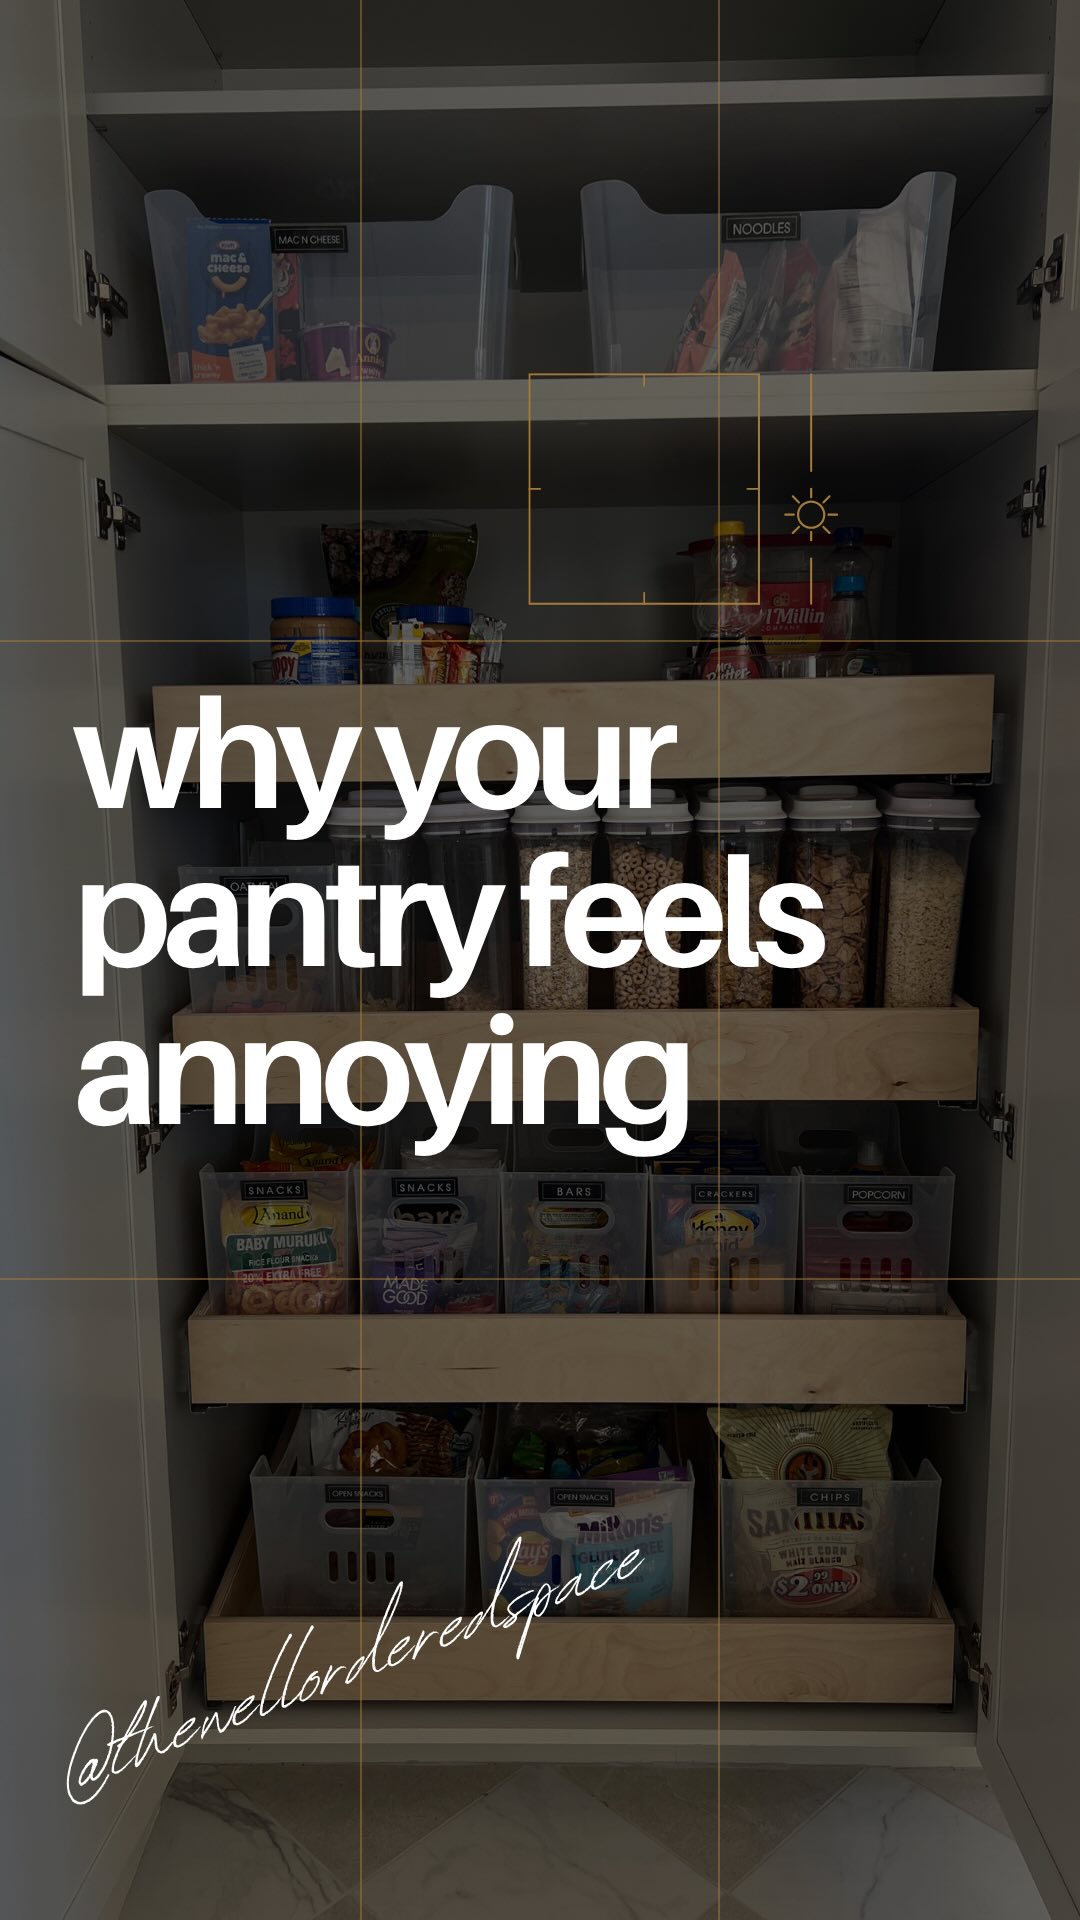
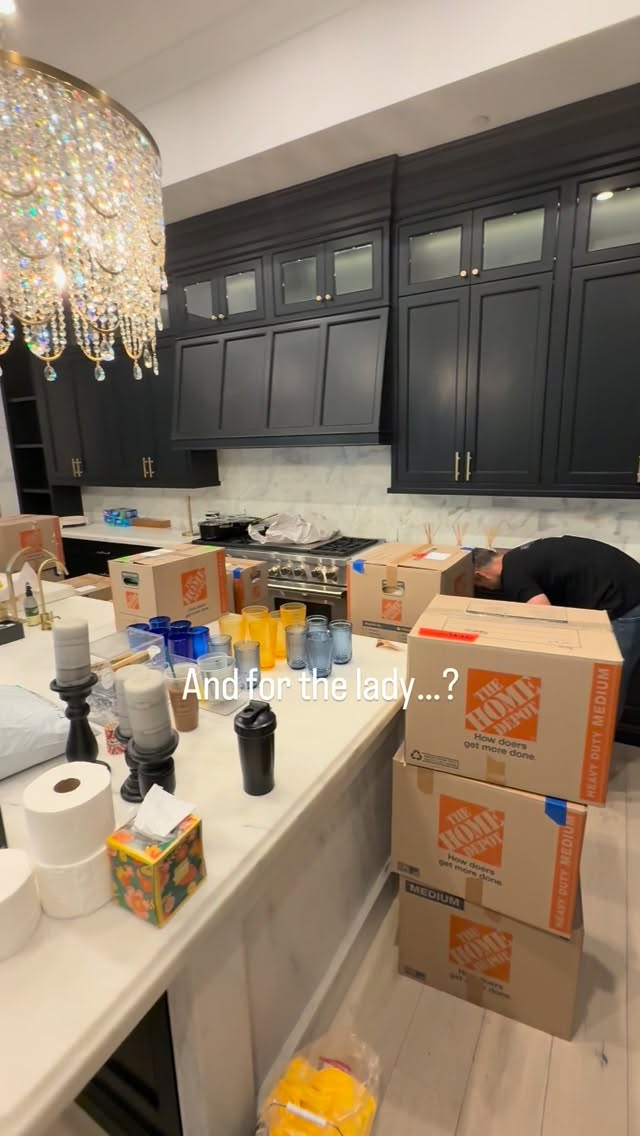
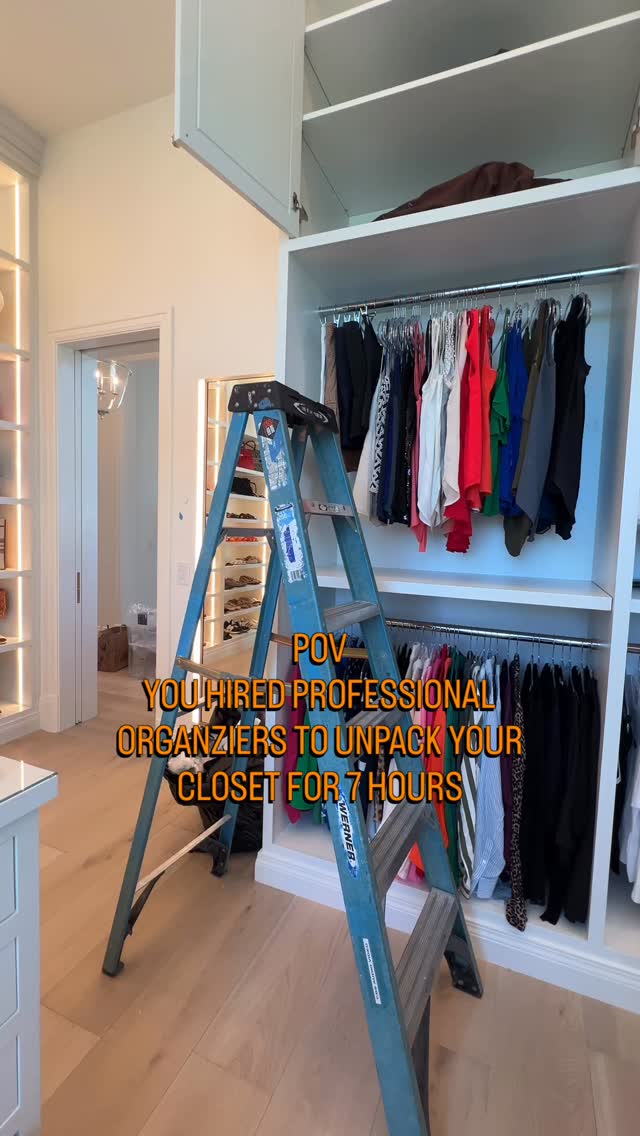
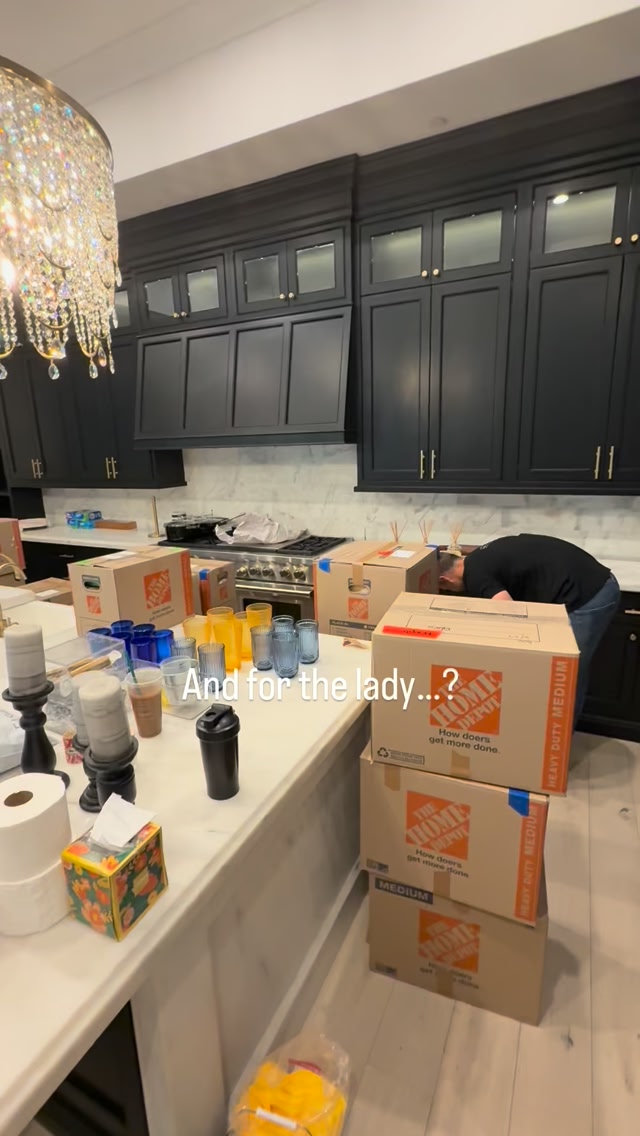
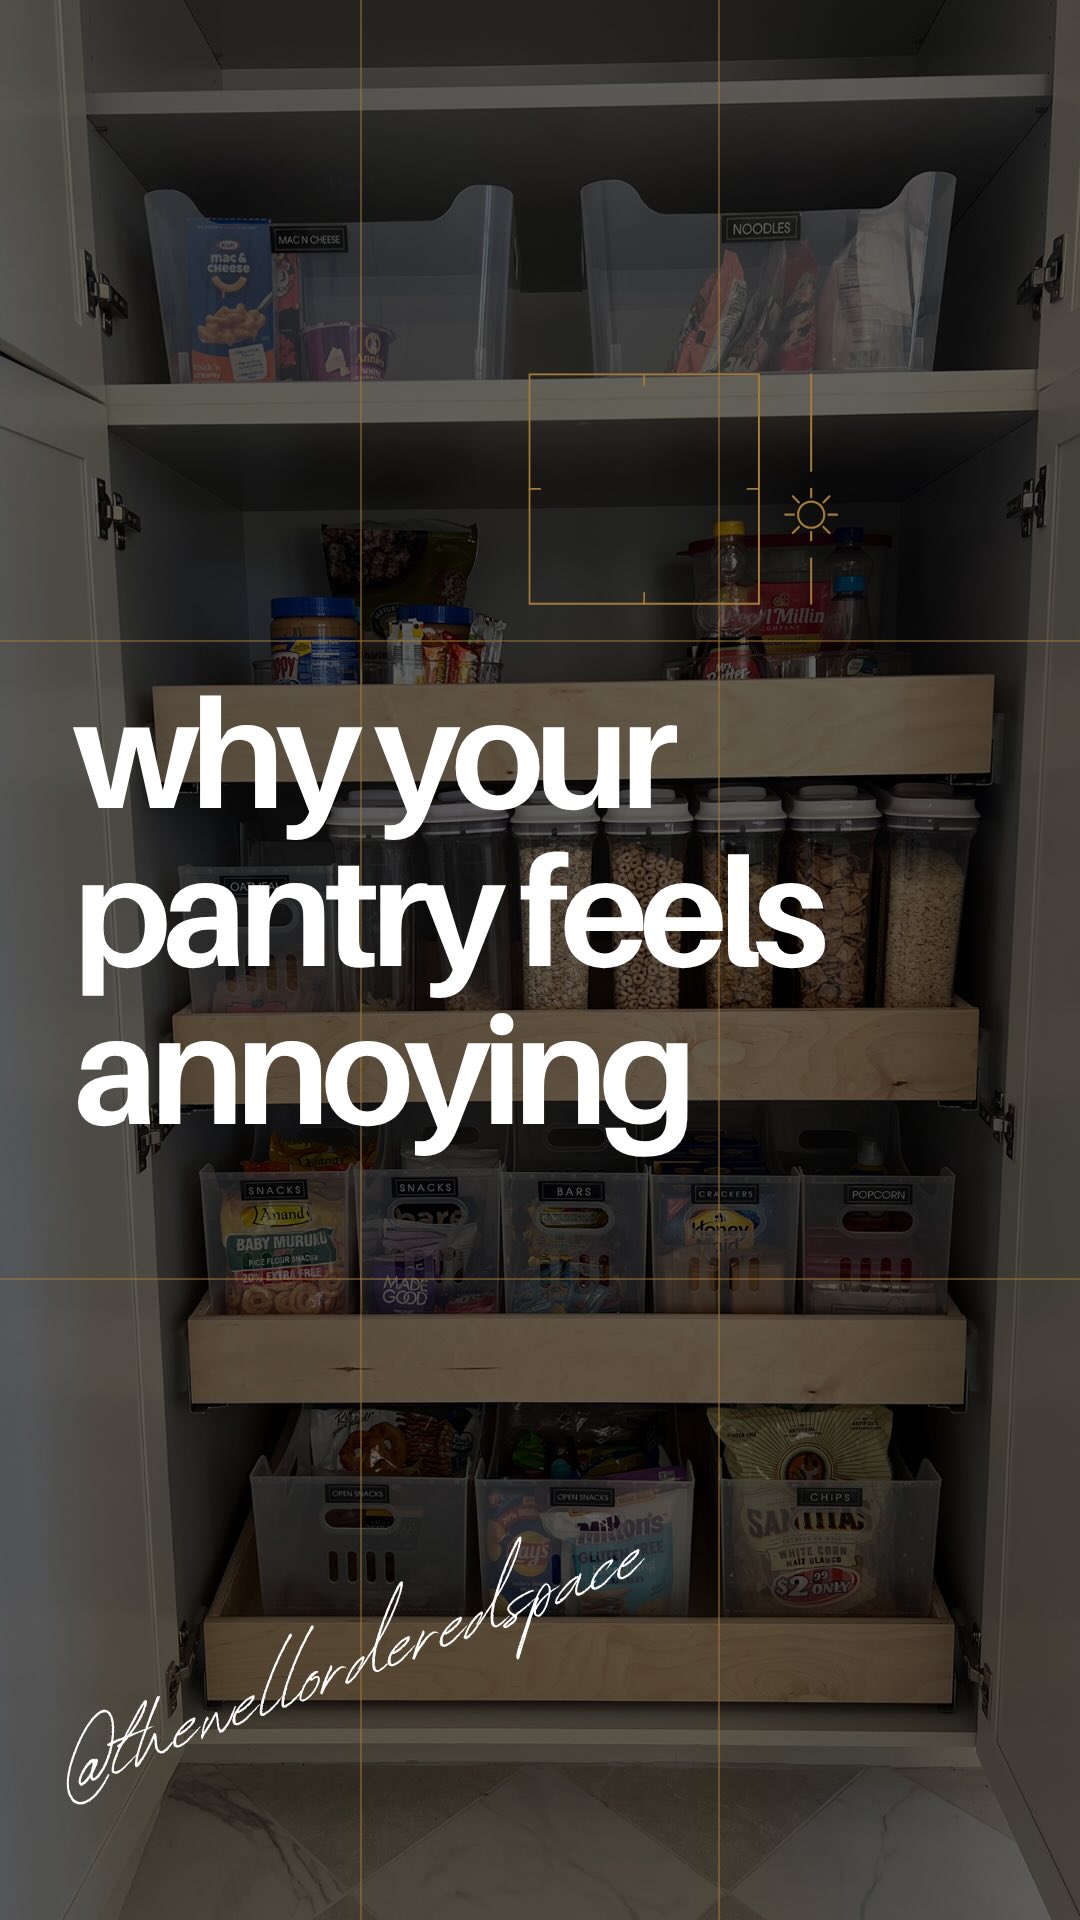
The five most-watched posts on each platform in July. Every card opens the real post in a new tab.




Local Visibility / Google Business Profile
Found on the map
How the listing performed across Google Search and Maps in July. Two listings are live, and the primary one carries most of the activity.
On-Page Behavior / Hotjar
Where hands went
Drag the handle to wipe between the clean Custom Quote page and the July click heatmap. Use it with your mouse, a touch, or the arrow keys.
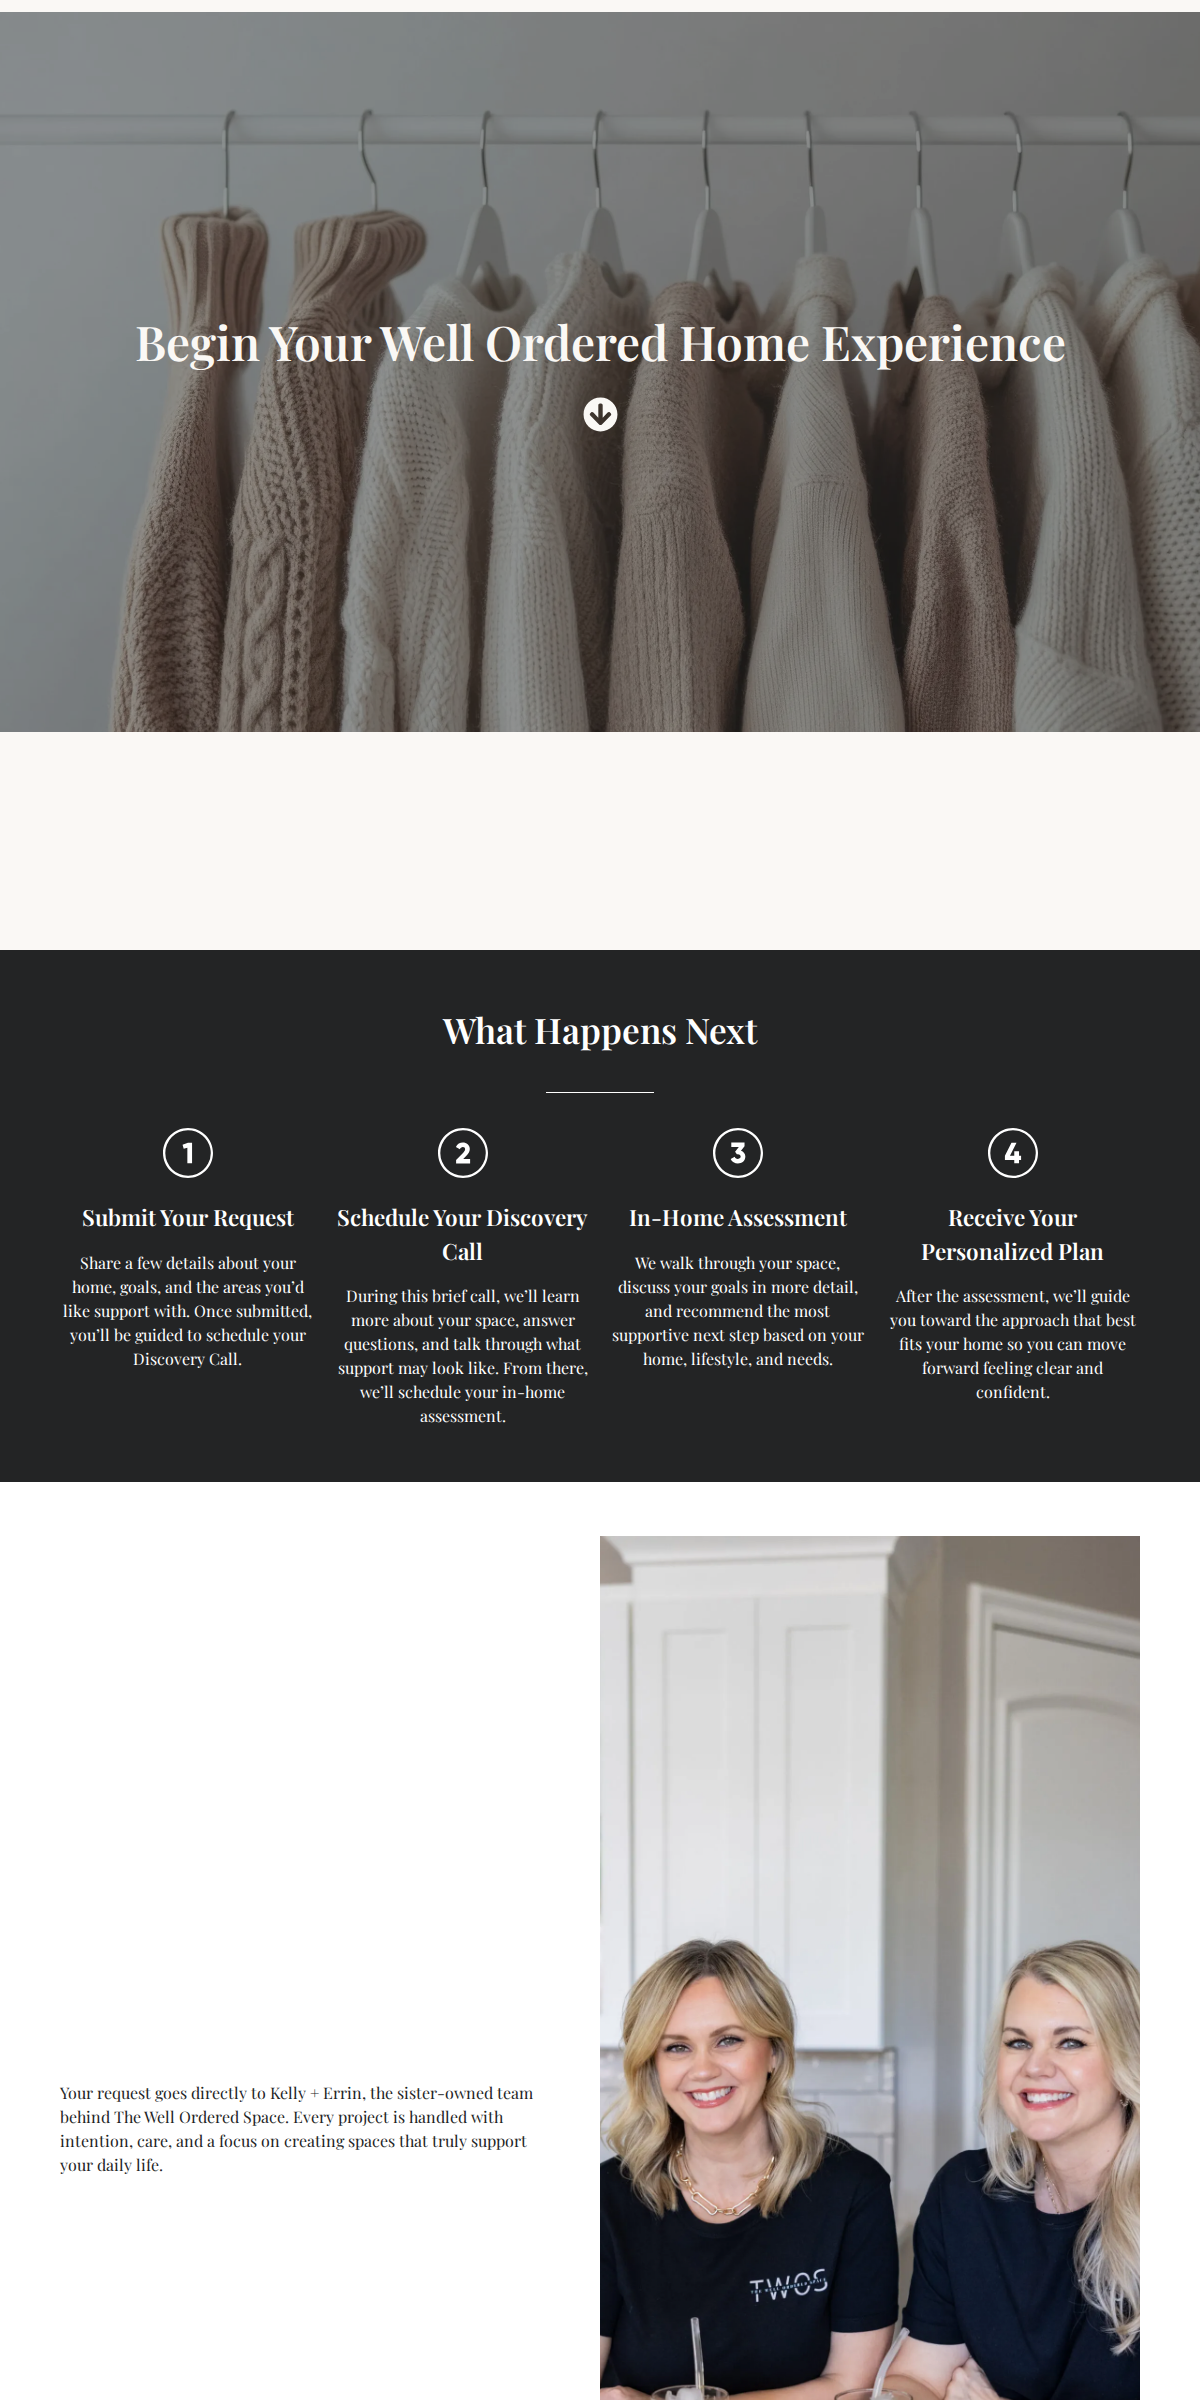
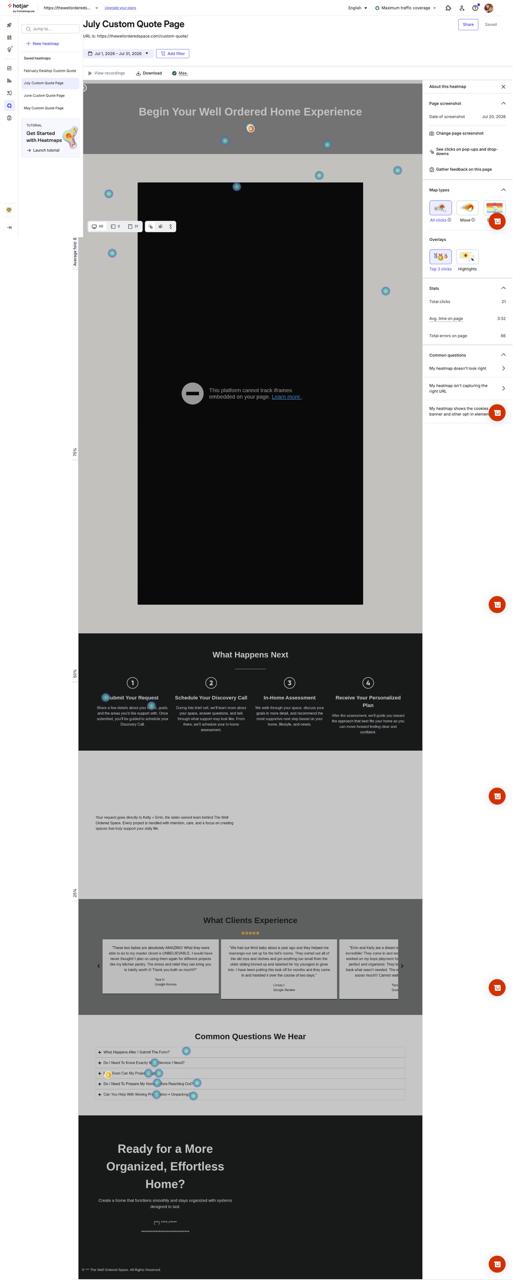
A useful thing to know: the HoneyBook form is an embedded iframe, and Hotjar cannot see inside it, so clicks on the form fields themselves are not captured. That is why the tracked clicks cluster on the header and around the edges of the form rather than on it. People are engaging with the form. The tool simply cannot record what happens inside the frame.