Views8,176
10 small projects to save hours of stress before school
Open reel
A calm read on how the month moved. Where people found you, what they watched, and what to lean into next.
01 Website overview
Steady traffic with strong depth per visit. People are not just landing, they are reading through the space.
02 Discovery funnel
The path that turns a curious visitor into a booked discovery call.
The Custom Quote page is the discovery-call page, a HoneyBook form now connected as the source of truth for real inquiries. That means every number here is a genuine hand raised, not a guess.
03 Posting rhythm
The green band is the healthy monthly range for Instagram, 14 to 21 posts. Drag the marker to see how the 9 you posted sits against it.
Two-thirds of the way to the sweet spot, and it is already paying off. Those 9 Instagram posts still pulled over 8,000 views on the top reel. A few more each week and the range is well within reach.
04 Top posts by views
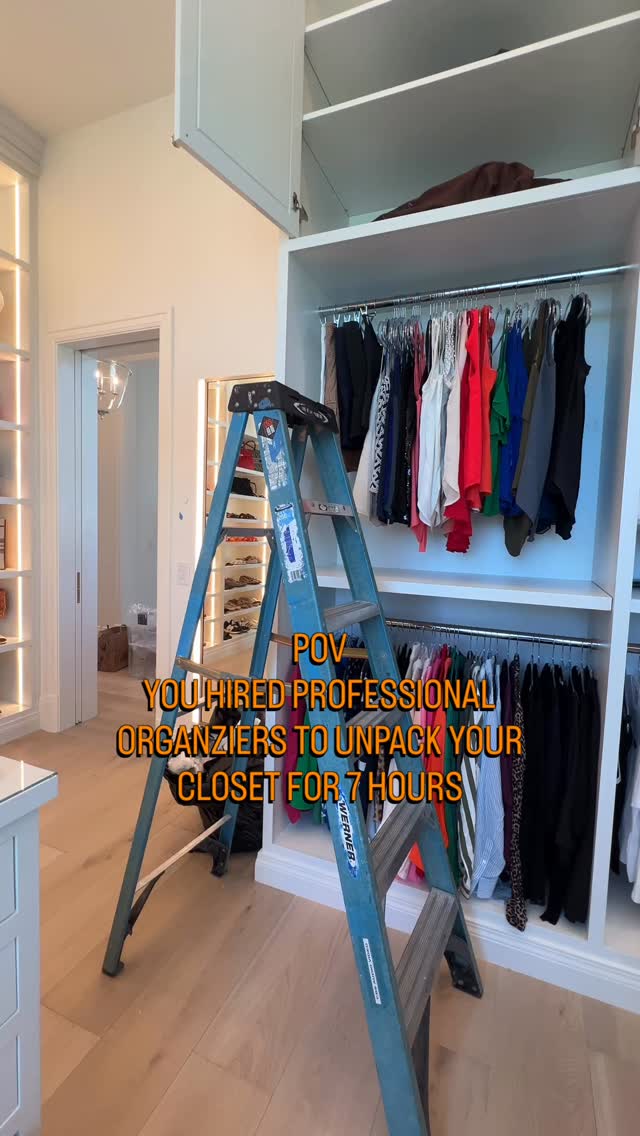
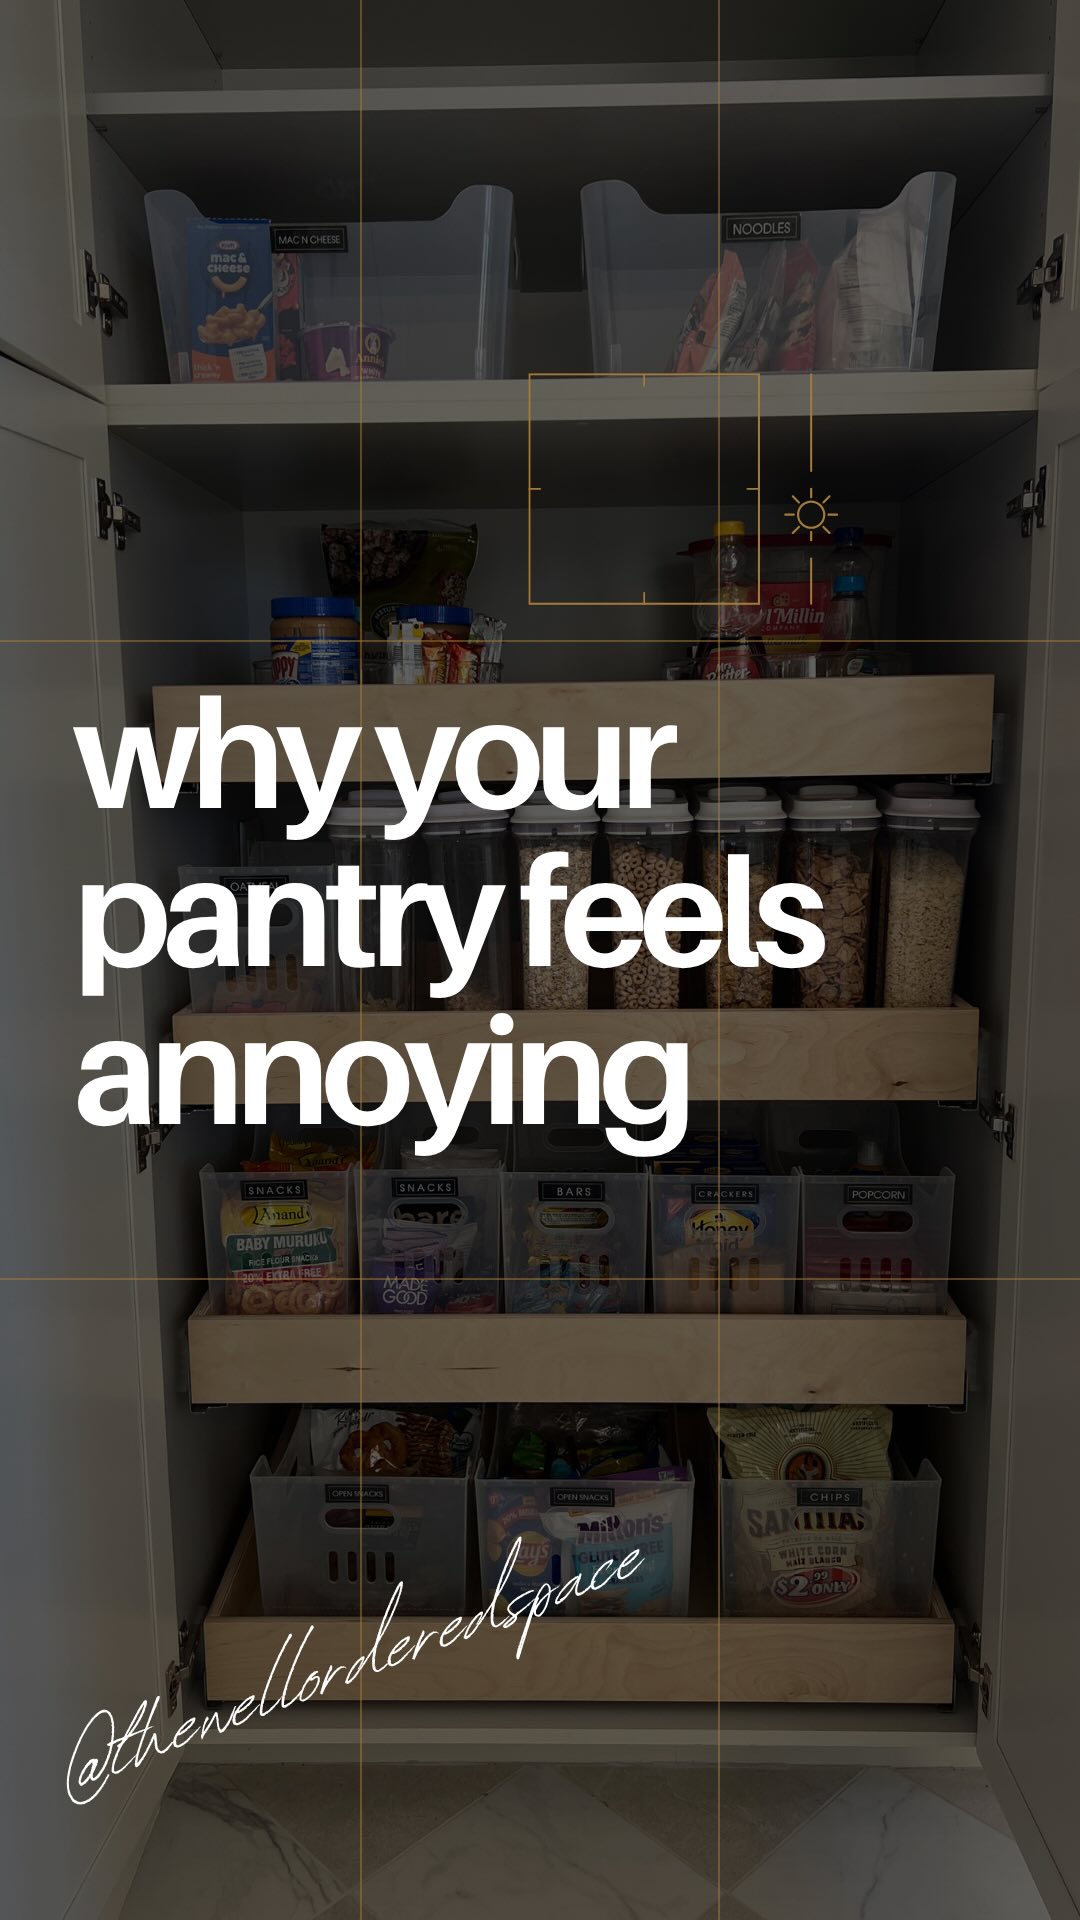
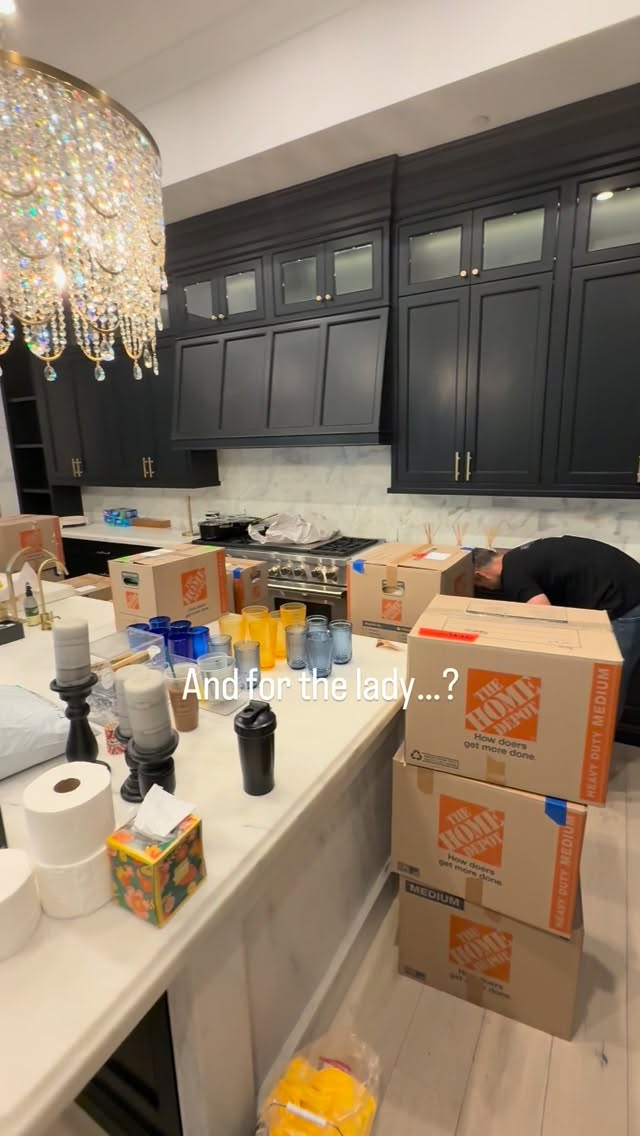
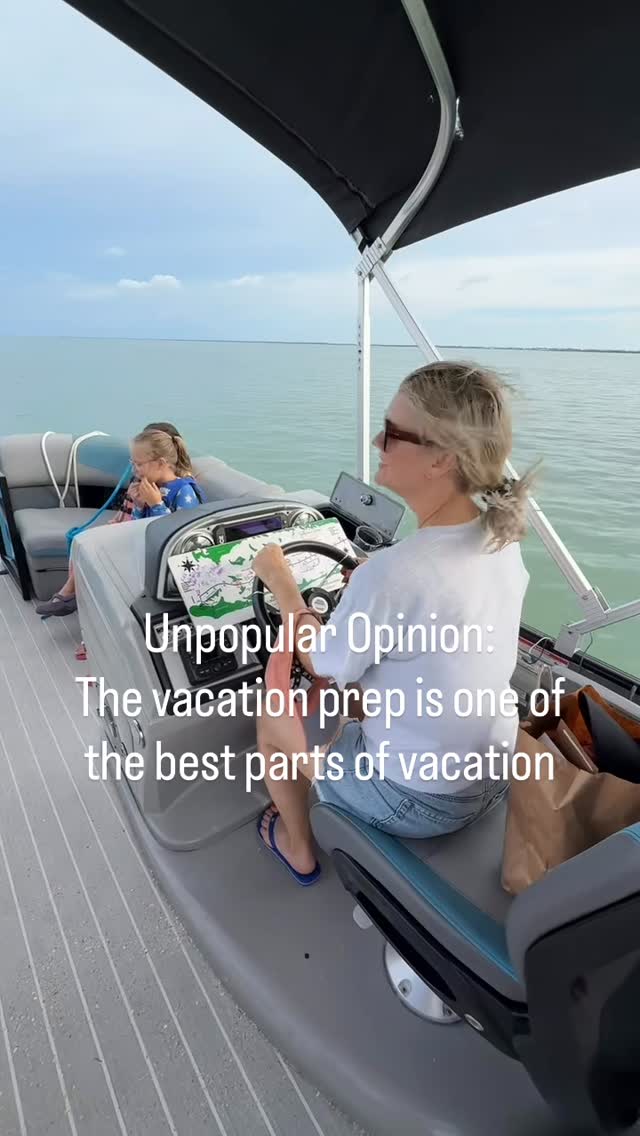
The five most-watched posts on each platform. Every card opens the real post in a new tab.

05 Google Business Profile
Combined visibility across both listings in July. The primary listing carries most of the activity.
Two listings are live for the business and the primary listing is the busier one. Direction requests are the standout here, people are looking up how to reach you.
06 Page heatmap
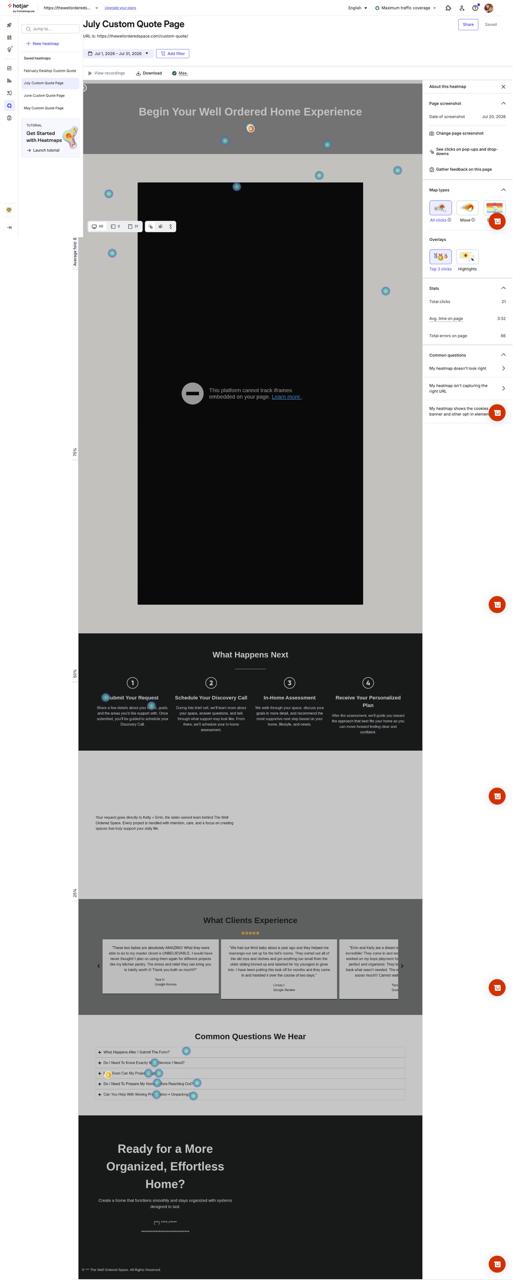
Drag the handle to wipe between the clean Custom Quote page and the Hotjar heatmap over it.
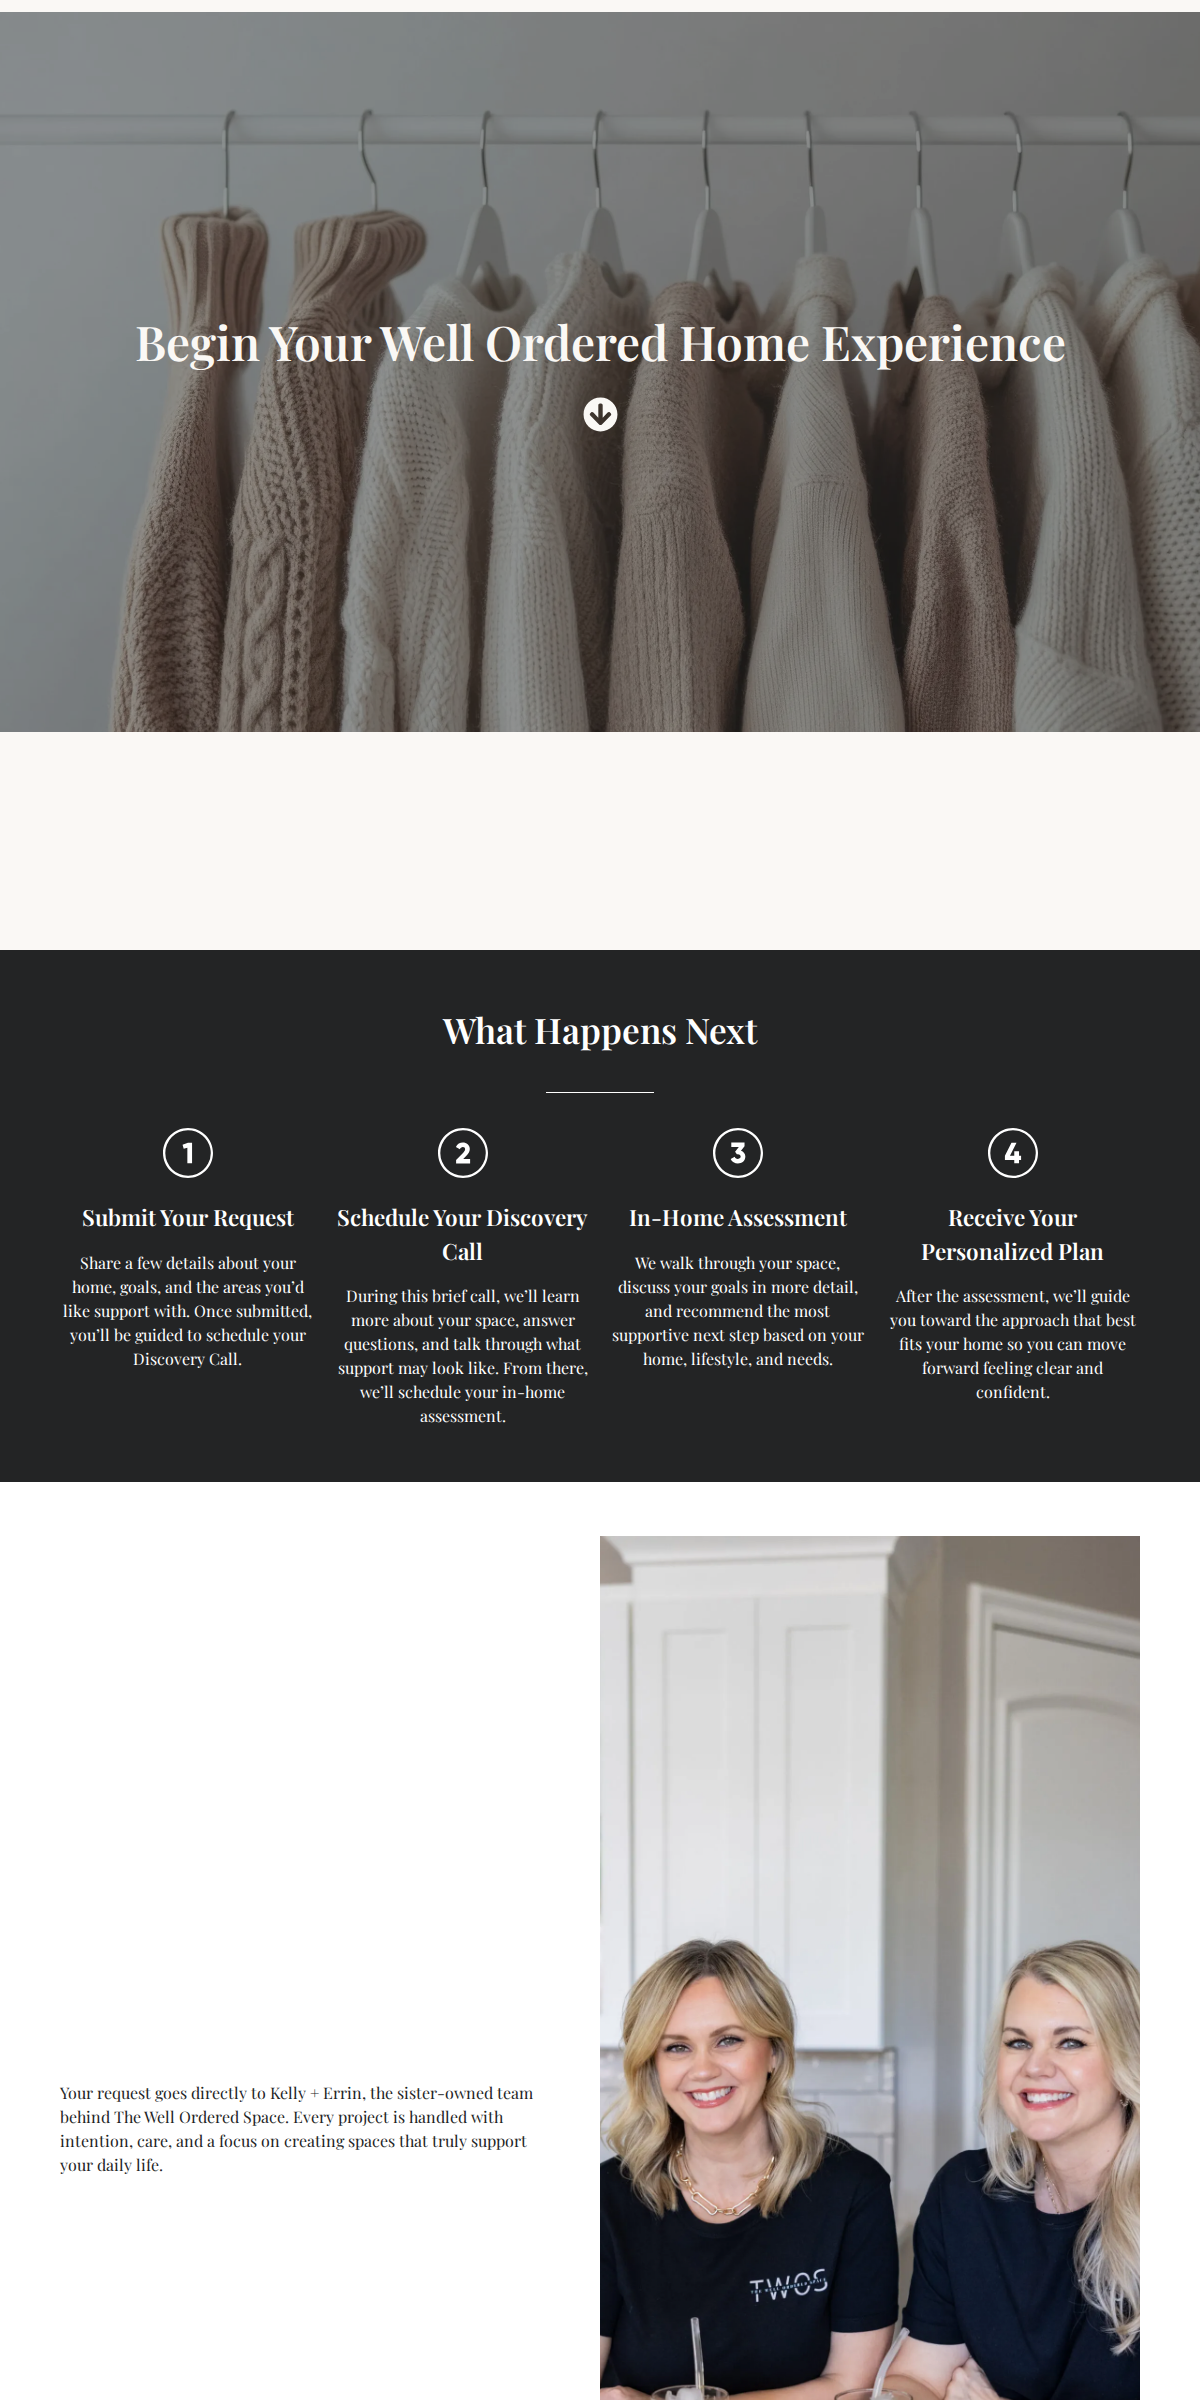
 Clean page
Heatmap
Clean page
Heatmap
The HoneyBook form is an embedded iframe that Hotjar cannot see inside, so clicks on the form itself are not captured. The tracked clicks cluster on the header and around the edges of the form, which tells us people are getting to it and engaging.